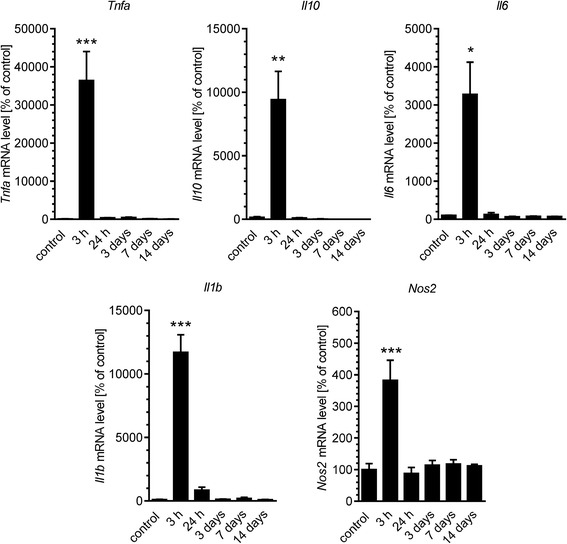
Fig. 3.

Relative changes in mRNA levels for TNF-α, IL-10, IL-6, IL-1β and iNOS in the hippocampus after Aβ treatment. Aβ (0.5 nmol) was injected intracerebroventricularly and gene expression was analysed 3 h and 1, 3, 7 and 14 days after injection by quantitative RT-PCR. Results were normalised to β-actin gene expression and are presented as the mean ± SEM from 4 to 12 independent experiments (n = 4–12). *, **, ***p < 0.05, 0.01 and 0.001 compared with the respective control using nonparametric Kruskal-Wallis followed by Dunn’s multiple comparisons test
