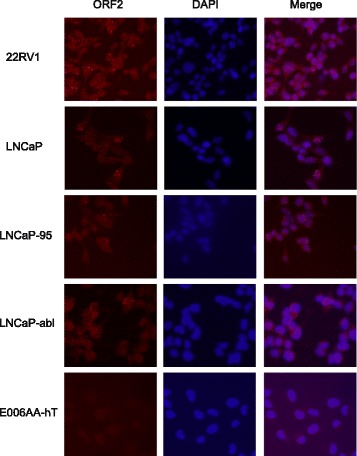
Fig. 3.

Immunofluorescence of endogenous ORF2p in a panel of prostate cancer cell lines. Cell lines, as described in Fig. 2, were probed for endogenous ORF2p (red) and counterstained with DAPI (blue) to visualize nuclei. Images were taken on a Nikon TI Eclipse confocal microscope under 20× magnification and a representative maximum-intensity projection is shown
