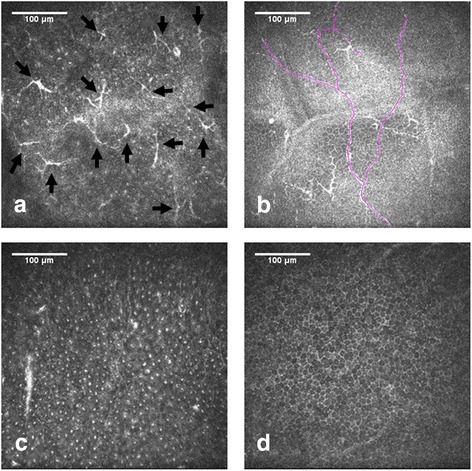
Fig. 4.

ICVM of basal epithelial cells in a patient with T2DM (a-c) and a control patient (d). Images from Bowman’s layer of the cornea with highly reflective Langerhans cell shown by black arrows (a); representative image showing decreased SBN density in T2DM (b); patient with T2DM showing lower basal epithelial cell density (c)
