
Fig. 3.
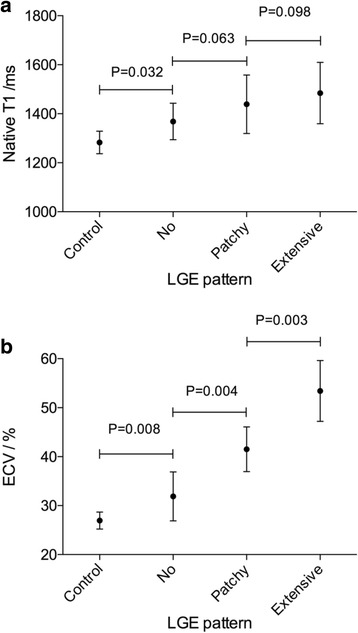
Native T1 and ECV values in AL amyloid subgroups with different LGE patterns. (a) Patients with no LGE showed an increase in native T1 (1368 ± 75 ms vs. 1283 ± 46 ms, P = 0.032), as compared to healthy controls. (b) Patients with no LGE showed an increase in ECV (31.9 ± 5.0% vs. 27.0 ± 1.7%, P = 0.008), as compared to healthy controls. LGE = late gadolinium enhancement, ECV = extracellular volume