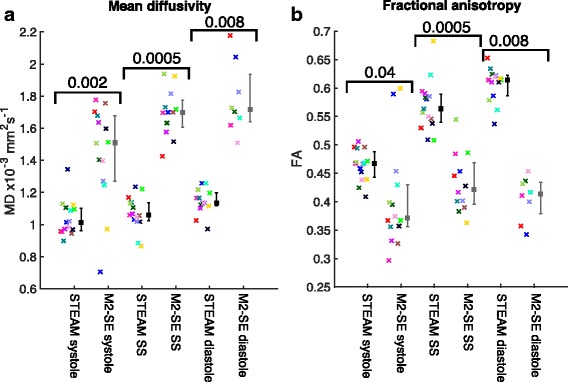
Fig. 6.

Mean diffusivity and fractional anisotropy results. A comparison of the mean LV MD (a) and FA (b) obtained from both sequences using the DT-CMR data at all three cardiac phases. The points are colour coded by subject, median and interquartile ranges are shown in black (STEAM) and grey (M2-SE) with the p-value obtained from a Wilcoxon signed rank test comparing the sequences at each cardiac phase shown above the data
