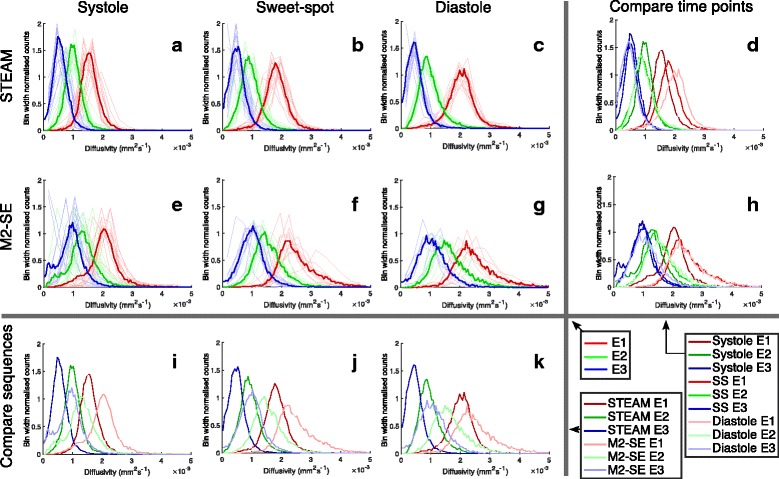
Fig. 8.

Eigenvalue histograms. Histograms of the eigenvalues obtained at each cardiac phase using both sequences. a–c and e–g show the histograms for the individual subjects (dashed lines) at each cardiac phase for STEAM and M2-SE respectively. The mean values are shown as solid lines. d and h compare the average histograms acquired at each cardiac phase for STEAM and M2-SE respectively. i, j and k compare the average histograms between the two sequences acquired at each cardiac phase. Each histogram was normalised to the number of samples (pixels) and then to the bin width used (0.3 × 10⁻³mm2⋅s−1 for individual subjects and 0.05 × 10⁻³mm2⋅s−1 for averaged histograms), giving y-axis units of 1/(10−3mm2⋅s−1)
