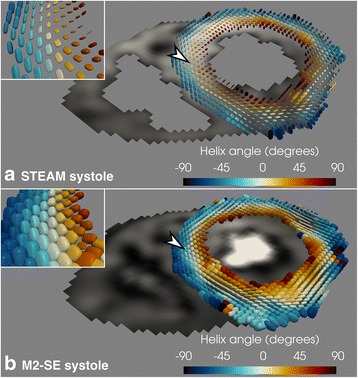
Fig. 9.

Superquadric glyph comparison. Example superquadric glyphs from both the STEAM (a) and M2-SE (b) sequences in systole. The elevated MD and reduced FA using M2-SE is evident in the zoomed inset regions as more cube like glyphs. The glyphs in the mid-wall of (b) are more perpendicular to the imaging plane due to the reduced E2A when using M2-SE. Arrow heads highlight the approximate centres of the inset regions on the main views
