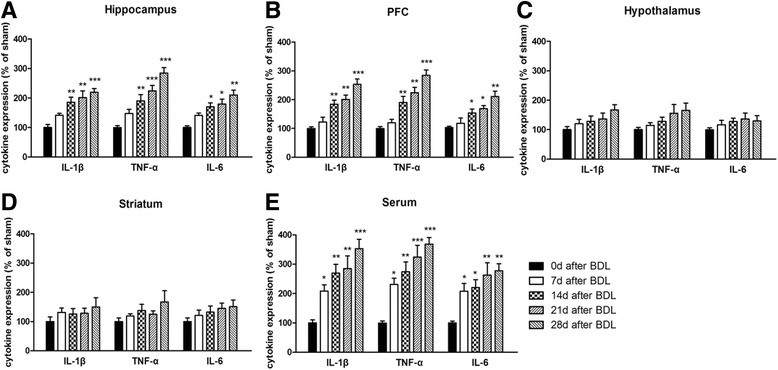
Fig. 3.

Expression of TNF-α, IL-1β, and IL-6 in the hippocampus (a), cerebral cortex (b), hypothalamus (c), striatum (d), and serum (e) of BDL animals in different days (0, 7, 14, 21, and 28 days) after surgery. Data are expressed as mean ± SEM (n = 6). *p < 0.05, **p < 0.01, and ***p < 0.001, when compared to the sham group
