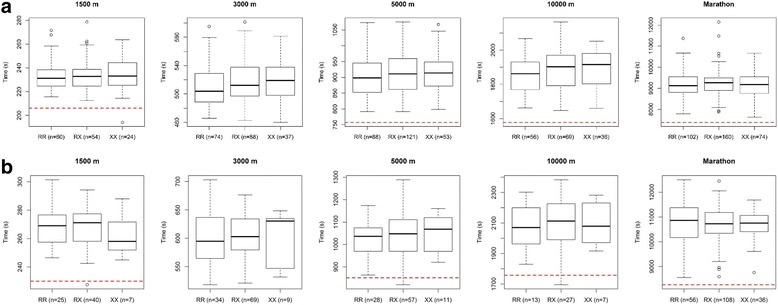
Fig. 1.

Individual 1500 m, 3000 m, 5000 m, 10,000 m personal best times in (a) male and (b) female endurance athletes according to their ACTN3 R577X genotype. Data are shown as boxplots and time is expressed in seconds. The red dashed line on each plot corresponds to the competition entry standard for the 2016 Olympic Games. 3000 m is not an Olympic event, so there is no red dashed line for this event
