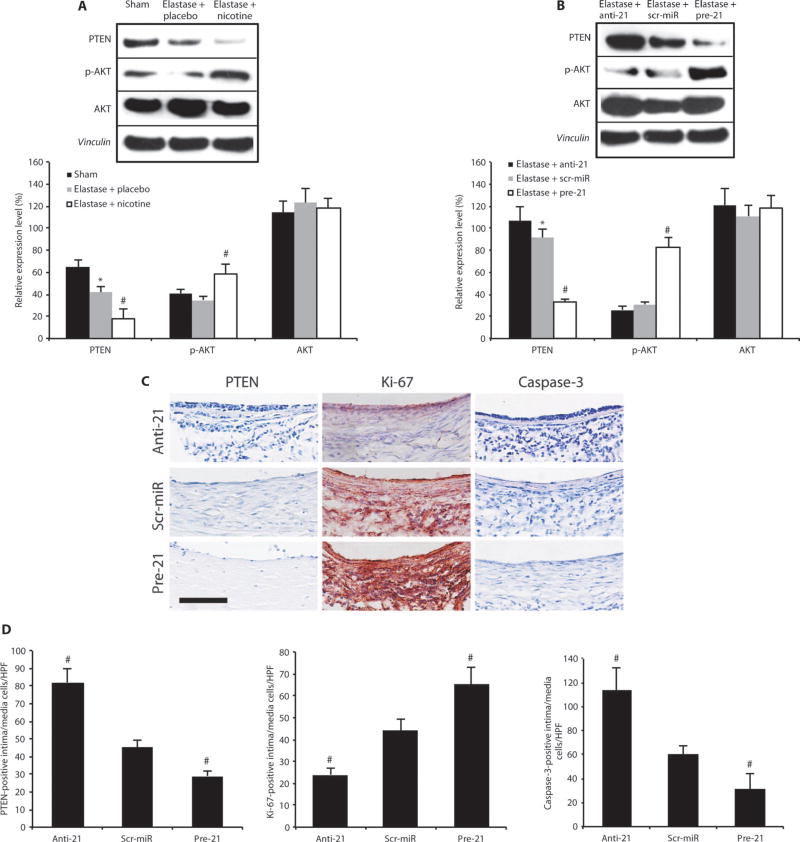
Fig. 4.
PTEN and p-AKT regulate proliferation and apoptosis in AAAs. (A) Representative immunoblots and expression levels for PTEN, p-AKT, and AKT relative to vinculin (loading control) in AAAs in elastase-infused mice (14 days after AAA induction) supplemented with either placebo or nicotine compared to saline-infused controls (sham; n = 3 to 4 mice per group). (B) Representative immunoblots and expression levels for PTEN, p-AKT, and AKT relative to vinculin (loading control) in AAAs in elastase-infusedmice (14 days after induction) transduced with anti-21 or pre-21 compared with scr-miR (n = 3 to 4 mice per group). (C) Representative immunohistochemical images demonstrating effects of treatment with anti-21, pre-21, or scr-miR 14 days after AAA induction with elastase on PTEN expression (blue), cell proliferation (red positive for Ki-67), and apoptosis (purple-blue positive for caspase-3). Scale bar, 50 µm. (D) Quantification of PTEN-positive, Ki-67–positive, and caspase-3–positive cells in the intimal and medial region of AAAs. n=4 high-power fields (HPF) of 3 different aortas per group (12 total per group) 14 days after AAA induction. Data are means ± SEM. *P < 0.05 versus saline-infused controls (sham); #P < 0.05 versus scr-miR and versus sham (or versus elastase + placebo and versus sham). Level of significance was determined using one-way ANOVA with Bonferroni’s post test.

