
Fig. 1.
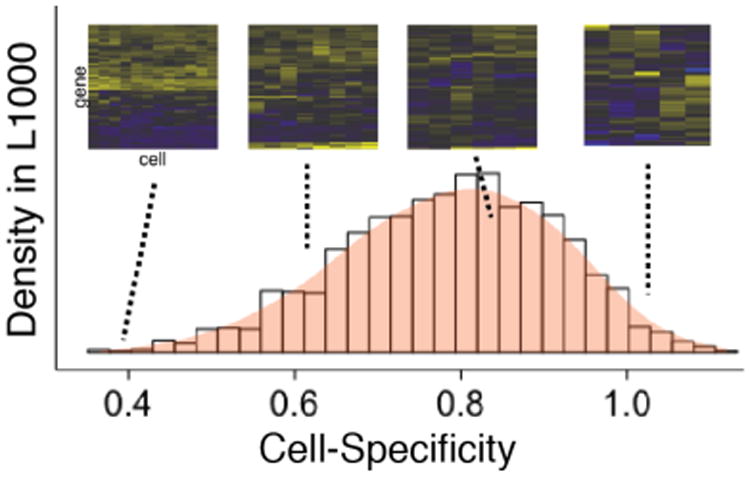
Distribution of cell-specificity of 2,130 drugs in the L1000 dataset. The cell-specificity is quantified per drug as the mean pairwise cosine distance between all of its cell-specific profiles, with a range of 0 (all cells identical) to 2 (perfect anti-correlation). Four examples are shown (L to R: homoharringtonine, terfenadine, dexamethasone, and JNJ-38877605). While some drugs induce very similar expression across cell types, the majority have higher cell-specificity corresponding to distinctive patterns in different cell types.