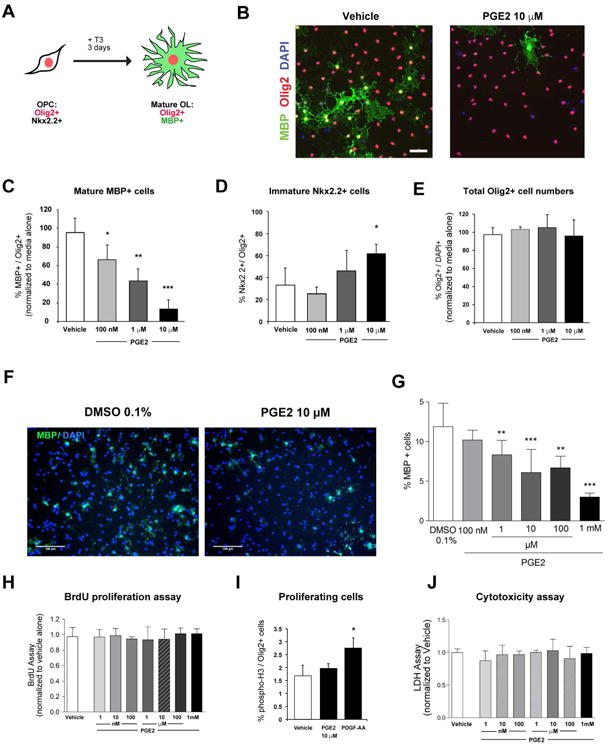
Figure 4. Prostaglandin E2 inhibits oligodendrocyte progenitor cell maturation.

A Schematic of oligodendrocyte maturation assay. Nk×2.2 marks immature progenitors and MBP marks maturing oligodendrocytes. B. Representative images of cells, stained for Olig2 and MBP, after 3 days of differentiation with or without PGE2 (scale bar, 25 μm). C & D. Quantification of MBP+ (C) and Nk×2.2+ cells (D) exposed to indicated doses of PGE2. E. Total Olig2+ cell numbers following exposure to indicated doses of PGE2. F & G. Representative images (scale bar, 100μm) and quantification of MBP staining following treatment of rat OPC cells with or without PGE2 from 100nM to 1mM (n=6 per group). H. BrdU incorporation in OPCs exposed to PGE2 from 1nM to 1mM for 24 hours (n=4 per group). I. Phospho-histone 3 expression in OPCs exposed to PGE2. J. LDH release from OPCs exposed to PGE2 from 1nM to 1mM for 24 hours (n=3 per group). * p-value <0.05, ** p-value <0.01, *** p-value <0.005 Data shown compiled from at least 3 independent experiments.
