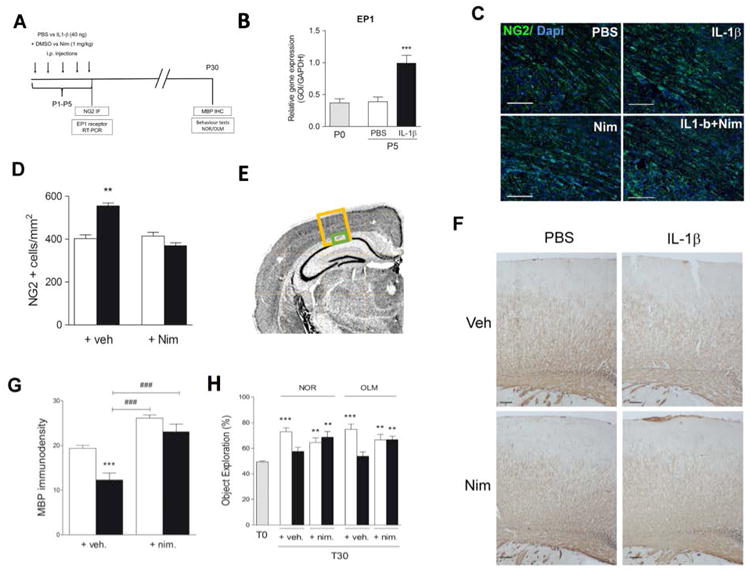
Figure 6. Cyclooxygenase-2 inhibition prevents hypomyelination and memory deficits.

A Timeline of postnatal intraperitoneal treatment by PBS (PBS + Veh.) or IL-1β (IL-1β + Veh.) or PBS with nimesulide (PBS + nim.) or IL-1β with nimesulide (IL-1β + nim.) from P1 to P5 and assessments performed. White bars correspond to PBS treatment, black bars to IL-1β treatment and grey bars to postnatal day 0 previous to i.p. injections B. Ep1 expression measured by RT-PCR at P5 (n=5 per group). C & D. Representative images and graph of NG2 staining within external capsule at P5. (scale bar, 25μm; n=5 per group). E. Image of anatomical areas where NG2 (green box) and MBP (yellow box) were quantified. F. Representative images of MBP immunostaining within the sensory-motor cortex of P30 aged mice (scale bar, 100μm). G. Optical densities of MBP staining within the sensory-motor cortex of P30 mice (n=6 per group). H. Mice were subjected to NOR and OLM tests at P30 (n=10-18 per group). First round = T0 (gray bar), second round = T30. Results are expressed in means +/- SEM. Asterisks indicate statistically significant differences from white bar, ** p<0.01, **** p< 0.001 in Mann-Whitney or One-Way ANOVA tests and ### p< 0.001 in comparison with IL-1β group.
