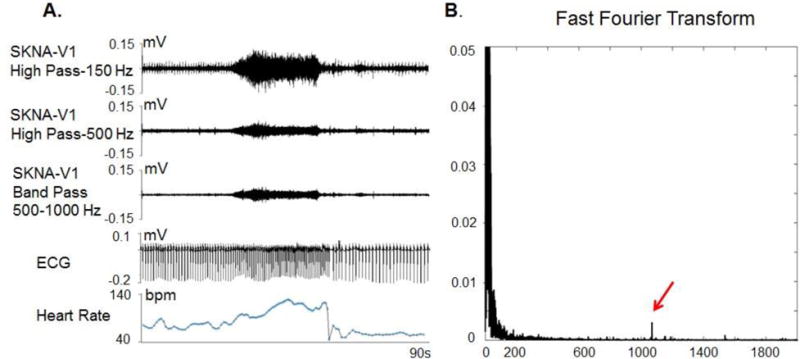
Figure 3.

Filter setting and signal to noise ratio of a recording from a healthy volunteer. Panel A shows the same data filtered with 3 different methods. After applying 150 Hz high pass filter, the ECG signals were incompletely eliminated but the nerve signals are clearly visible with a good signal to noise ratio. After applying the same data with a 500 Hz high pass filter, all ECG signals are eliminated by the signal to noise ratio for the nerve signal is reduced by approximately 50%. A Fast Fourier Transform analyses (Panel B) shows a high power signal (red arrow) slightly higher than 1000 Hz. This high power signal might be noise. Applying a band pass filter between 500 Hz and 1000 Hz eliminated that noise and reduced the thickness of the baseline, hence improved the signal to noise ratio of the SKNA. (From Online Data Supplement, Doytchinova et al, Heart Rhythm 2017)(47)
