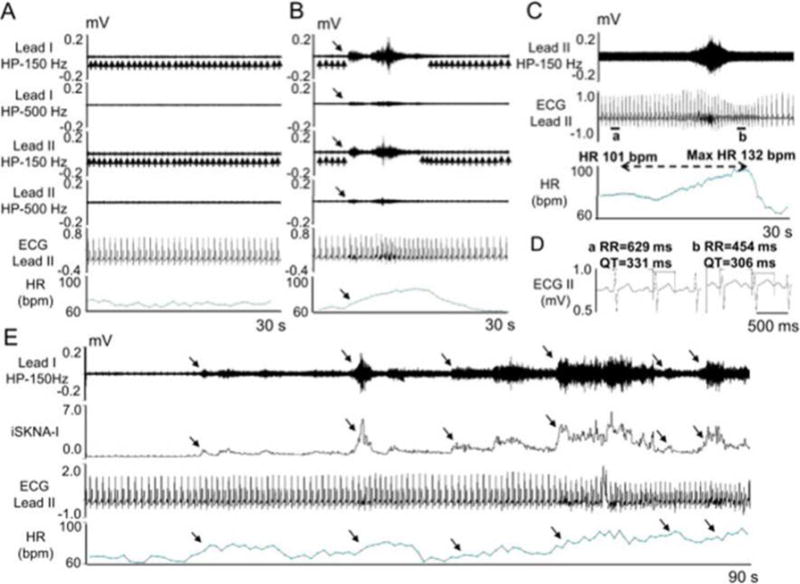
Figure 6.

SKNA recording in patients without known heart diseases. The electrodes were placed on the chest to form Lead I and Lead II. A - Baseline recording in leads I and II filtered at either 150 Hz or 500 Hz high pass to display SKNA and low pass filtered at 10 Hz to display the ECG. B - Episode of SKNA associated with heart rate (HR) acceleration (downward arrows). The 150 Hz high pass filter resulted in better signal to noise ratio and higher amplitude of SKNA, but some ECG signals remained (upward arrows). High pass filter at 500 Hz largely eliminated the ECG signals, but also reduced nerve amplitude and the signal to noise ratio. The baseline artifact on the surface ECG occurred after the onset of SKNA, suggesting motion artifacts induced by muscle movement. C - SKNA (500 Hz high pass, Lead II) and ECG tracings (125 Hz low pass) from a different patient. There was abrupt increase of HR from 101 beats per minute (bpm) to a maximum (1 max) of 132 bpm after SKNA activation, along with QT interval shortening. D - Enlarged ECG from line segments a and b in panel C. Both the RR and the QT interval shortened after SKNA. E - 90 s recording at baseline, illustrating spontaneous SKNA episodes and their relationship with HR. HP=high pass, LP=low pass, bpm=beats per minute. (From Doytchinova et al, Heart Rhythm 2017)(47)
