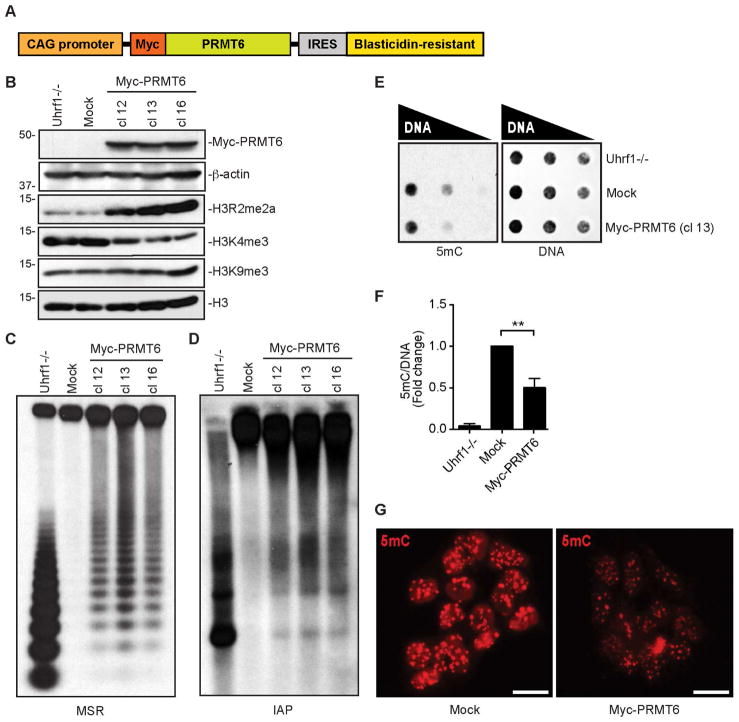
Figure 1. Overexpression of PRMT6 in mESCs induces global DNA hypomethylation.
(A) Diagram of Myc-PRMT6 plasmid.
(B) Western blots showing the levels of Myc-PRMT6 and histone marks in stable mESC clones. Mock, mESCs transfected with empty vector. Uhrf−/−, Uhrf1 knockout mESCs.
(C and D) Southern blots showing DNA methylation at MSR (C) and IAP (D) after digestion of genomic DNA with the methylation-sensitive restriction enzyme HpaII.
(E) Dot blot analysis of genomic DNA with 5mC antibody (left). The same membrane was stained with SYTOX Green to verify equal DNA loading (right).
(F) Quantification of data in (E) by densitometry using Image J. Shown are relative 5mC levels (mean + SD from three independent experiments). Paired t test was used to determine statistical significance. **P < 0.01.
(G) IF analysis with 5mC antibody. Scale bars, 15 μm.

