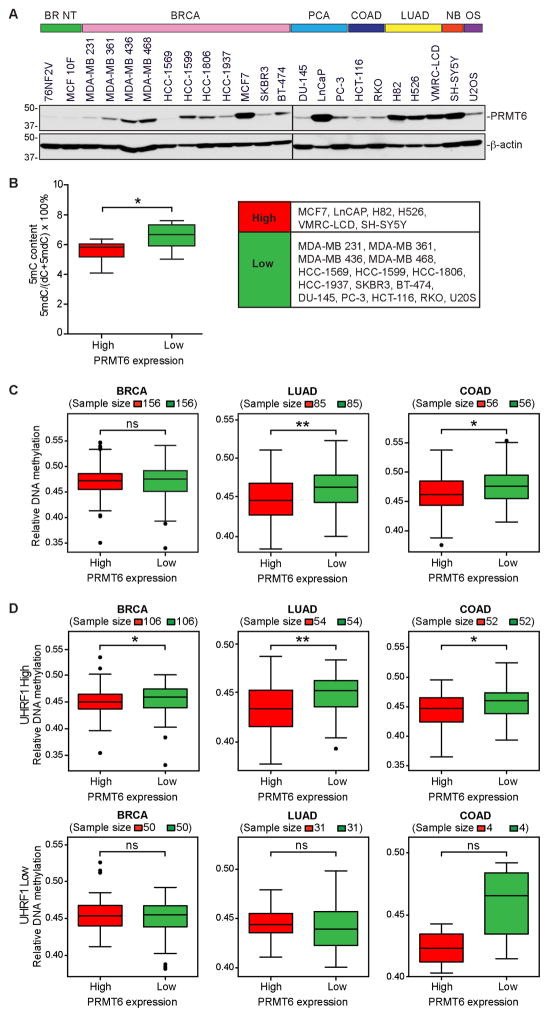
Figure 3. PRMT6 expression inversely correlates with DNA methylation in human cancer cells.
(A) Western blots showing PRMT6 levels in human cancer cell lines. BR NT, breast non-tumorigenic; BRCA, breast cancer; PCA, prostate cancer; COAD, colorectal adenocarcinoma; LUAD, lung adenocarcinoma; NB, neuroblastoma; OS, osteosarcoma.
(B) Comparison between PRMT6-high and PRMT6-low cell lines for 5mC levels (determined by LC-MS/MS, see Table S1).
(C and D) Correlation of PRMT6 expression and DNA methylation data from the TCGA database. The mean DNA methylation levels between cancer samples with the highest (top 20%) and lowest (bottom 20%) PRMT6 expression in each cancer type were compared, either without considering UHRF1 expression (C) or by dividing all samples into UHRF1-high (upper 70%) and UHRF1-low (lower 30%) groups before analysis (D). Note that the 30% cutoff for UHRF1 expression was based on merged datasets of the three cancer types and, therefore, the sample numbers of UHRF1-high and UHRF1-low groups in each cancer type do not make up precisely 70% and 30%, respectively.
Wilcoxon rank sum non-parametric test with two-tailed P value was used to determine the significance of differences in (B–D). *P < 0.05; **P < 0.01; ns, not significant.

