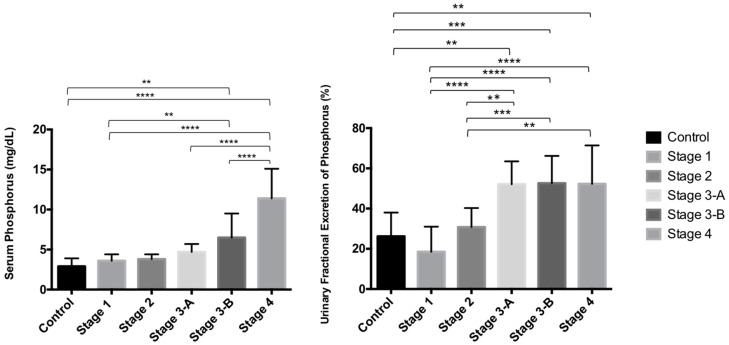
Figure 2.
Data in graph are presented as mean ± standard deviation (SD) and statistical analysis (p values—Turkey multiple comparison test) of serum phosphorus concentration (sP; mg/dL) and urinary fractional excretion of phosphorus (uFEP; %) in control dogs (C) and in dogs with chronic kidney disease with stage 1 (St 1), stage 2 (St 2), stage 3-A (St 3-A), stage 3-B (St 3-B) and stage 4 (St 4). ** p < 0.01; *** p < 0.001; **** p < 0.0001.

