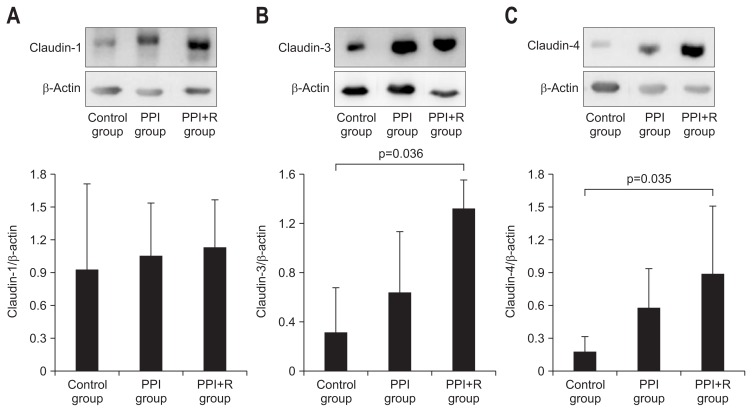
Fig. 4.
(A) Western blot analysis for claudin-1 in each group. There were no differences among the groups. (B) Western blot analysis for claudin-3 in each group. The expression of claudin-3 decreased in the control group compared with the PPI+R group. (C) Western blot analysis for claudin-4 in each group. The expression of claudin-4 decreased in the control group compared with the PPI+R group.
PPI, proton pump inhibitor; PPI+R, PPI plus rebamipide.

