Figure 1.
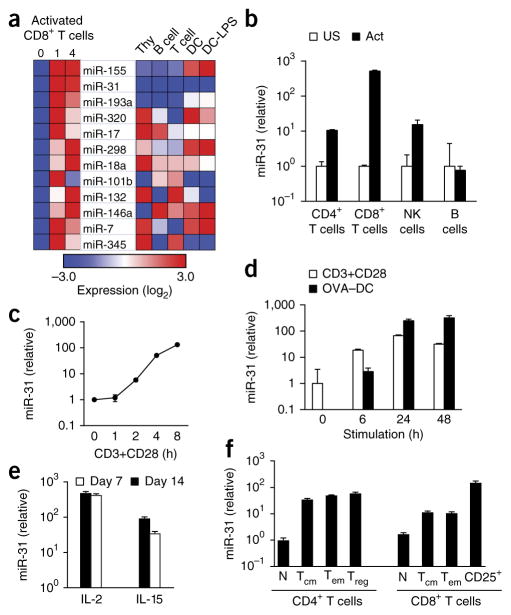
miR-31 is induced during T cell activation. (a) miRNAs (middle) with an increase in expression of more than twofold following activation of CD8+ T cells for 1–4 d with anti-CD3 plus anti-CD28, relative to that of unstimulated cells (day 0) (left), and expression of those miRNAs in total thymocytes (Thy), B cells, T cells, bone-marrow-derived DCs (DC) and LPS-treated DCs (DC-LPS) (right), presented as row-normalized relative expression (log2). (b) qPCR analysis of miR-31 in CD4+ or CD8+ T cells activated (Act) for 24 h with anti-CD3 plus anti-CD28, NK cells activated for 24 h with PMA and ionomycin, and B cells activated for 24 h with an antibody to immunoglobulin M and CpG; results are presented relative to those of the unstimulated counterparts (US). (c) qPCR analysis of miR-31 in CD8+ T cells activated for 0–8 h (horizontal axis) with anti-CD3 plus anti-CD28 (CD3+CD28); results are presented relative to those at 0 h. (d) qPCR analysis of mir-31 in OT-I T cells activated for 0–48 h (horizontal axis) with anti-CD3 plus anti-CD28 (CD3+CD28) or by co-culture with OVA-peptide-pulsed DCs (OVA–DC) (T cell/DC ratio, 1:1) (key); results presented as in c. (e) qPCR analysis of mir-31 in OT-I CD8+ T cells activated for 48 h by OVA-peptide-pulsed splenocytes, then treated for 7 or 14 d (key) with IL-2 or IL-15 (horizontal axis); results are presented relative to those of untreated cells. (f) qPCR analysis of mir-31 in naive (CD44loCD62L+) T cells (N), effector memory (CD44hiCD62L−) T cells (TEM), central memory (CD44hiCD62L+) T cells (TCM), regulatory (CD4+CD25+GITR+) T cells (Treg), and activated CD8+ (CD8+CD25+) T cells (CD25+), with all CD4+ or CD8+ subsets (horizontal axis) sorted ex vivo; results are presented relative to those of naive T cells. Data are representative of one experiment (a), three experiments (b; error bars, s.d.) or two experiments (c–f; error bars (d–f), s.d.).

