Figure 7.
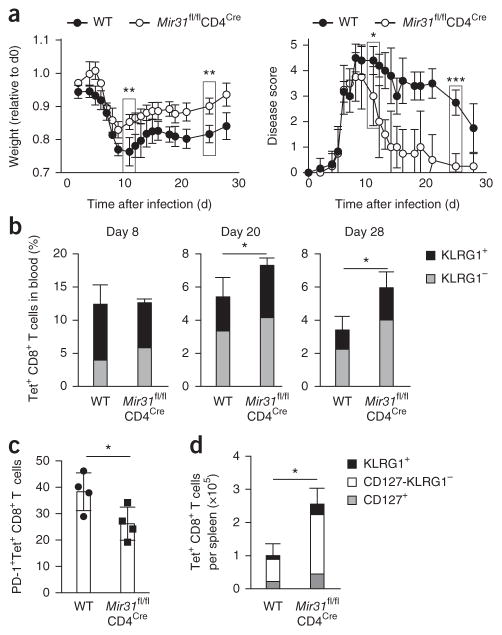
T cell–intrinsic effect of miR-31 on anti-viral CD8+ T cell responses during chronic infection with LCMV. (a) Body weight (left) and disease scores (right) of wild-type and Mir31fl/flCd4Cre mice (n = 4 per group) infected intravenously with LCMV clone 13 (1 × 10⁶ plaque-forming units), assessed daily before (day 0) and following infection; weight is presented relative to starting body weight (day 0). **P = 0.003 (day 12) and **P = 0.001 (day 25), body weight; *P = 0.01 (day 12) and ***P = 0.0004 (day 25), disease score (unpaired two-tailed Student’s t-test). (b) Frequency of KLRG1+ and KLRG1− cells (key) among Tet+ CD8+ T cells in the blood of mice as in a (n = 4 per group), assessed by flow cytometry at days 8, 20 and 28 after infection. *P = 0.02 (day 20) and *P = 0.03 (day 28) (unpaired two-tailed Student’s t-test). (c) Frequency of PD-1+Tet+ CD8+ T cells in the blood of mice as in a (n = 4 per group), assessed by flow cytometry at day 20 after infection treated. *P = 0.04 (unpaired two-tailed Student’s t-test). (d) Quantification of KLRG1+, CD127−KLRG1− and CD127+ cells (key) among Tet+ CD8+ T cells in the spleen of mice treated as in a (n = 4 per group), assessed by flow cytometry. Each symbol (c) represents an individual mouse. *P = 0.002 (unpaired two-tailed Student’s t-test). Data are representative of one experiment (error bars, s.d.).

