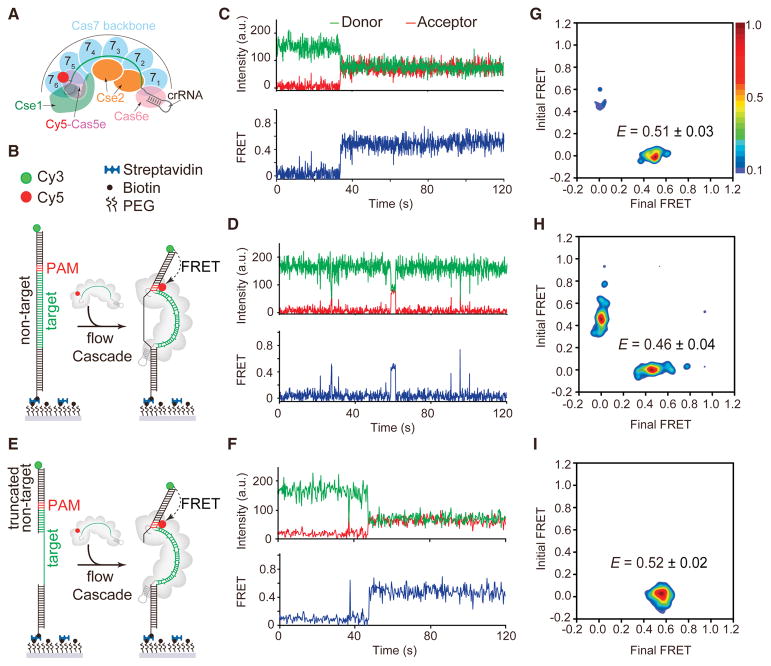
Figure 1. Real-time observation of Cascade target searching and binding by smFRET.
(A) Schematic of Cascade labeled with Cy5 in the Cas5e subunit. (B) Schematic of smFRET experiment using dsDNAtarget and targeting Cascade. (C–D) A representative smFRET time trajectory of (C) long-lived or (D) short-lived FRET events for targeting Cascade and dsDNAtarget. (E) Schematic of smFRET experiment using dsDNAtrunc and targeting Cascade. (F) A representative smFRET time trajectory of long-lived FRET for targeting Cascade and dsDNAtrunc. (G) Transition density plot of long-lived FRET events for targeting Cascade and dsDNAtarget with a FRET peak centered at 0.51. (H) Transition density plot of short-lived FRET events for targeting Cascade and dsDNAtarget with a FRET peak centered at 0.46. (I) Transition density plot of all FRET events for targeting Cascade and dsDNAtrunc with a FRET peak centered at 0.52. See also Figure S1–S4 and Table S3.

