
Figure 4.
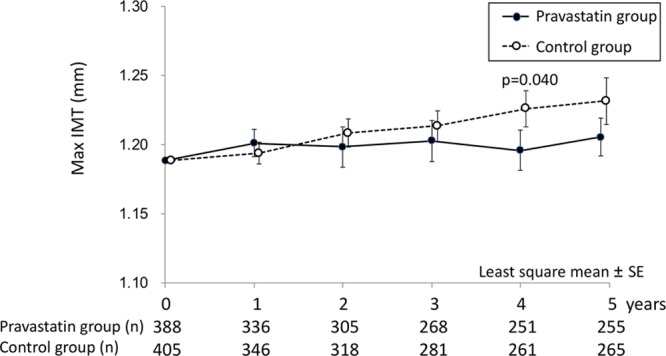
Temporal trends of maximum intima–media thickness (IMT) by allocated groups for 5 years are shown. Each data indicate the least square mean of the difference from baseline.
Official websites use .gov
A
.gov website belongs to an official
government organization in the United States.
Secure .gov websites use HTTPS
A lock (
) or https:// means you've safely
connected to the .gov website. Share sensitive
information only on official, secure websites.
Temporal trends of maximum intima–media thickness (IMT) by allocated groups for 5 years are shown. Each data indicate the least square mean of the difference from baseline.