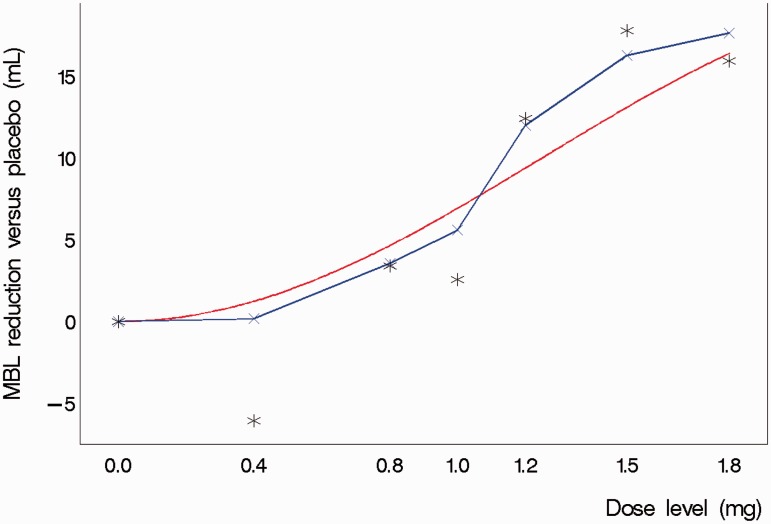
Figure 1.
Illustration of a Normal Dynamic Linear Model fit to simulated trial data based on a theoretical dose–response relationship. The figure shows the theoretical dose-response curve, the piecewise linear fit derived from the Normal Dynamic Linear Model and the actual observed means from a single simulated trial realisation (stars).The outlying mean at 0.4 mg was based on just six patients randomised to this dose and consequently had a relatively smaller influence on the model estimate of the treatment effect at that dose.

