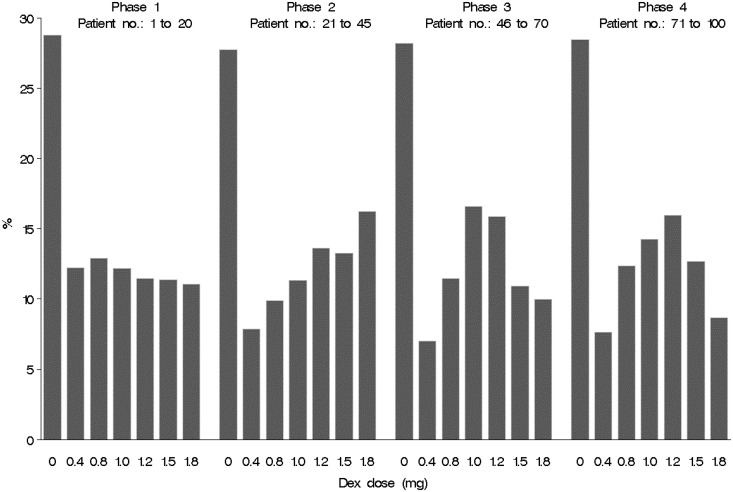
Figure 4.
Proportion of patients randomised to each of seven trial arms during the four phases of an adaptive trial with three adaptations and fixed 28.6% allocation probability on placebo. Phase 1: before adaptation commences, equal allocation probability across all active doses. Phase 2: after adaptation #1 based on MBL outcome data collected on the first 20 patients. Phase 3: after adaptation #2 based on MBL outcome data collected on the first 45 patients. Phase 4: after adaptation #3 based on MBL outcome data collected on the first 70 patients. The data presented are the average proportions observed from 200 simulated trial runs. The most effective dose was between 1.0 and 1.2 mg.

