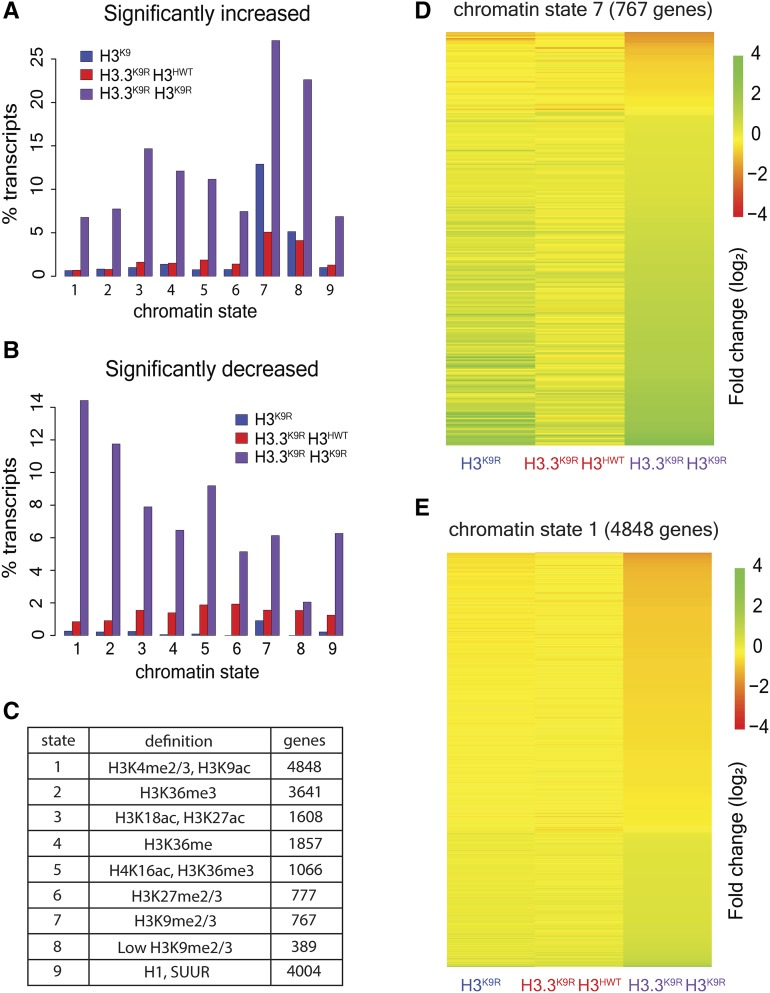
Figure 7.
H3.3K9 and H3K9 redundancy differs in heterochromatin and euchromatin. (A and B) Percentage of transcripts in a chromatin state that have significantly increased (A) or decreased (B) RNA signal in mutants vs. H3HWT. (C) Table indicates the number of transcripts that overlap a particular chromatin state. (D and E) Heatmaps showing fold change of K9R mutants over H3HWT at chromatin state 7 regions (D) and chromatin state 1 regions (E). Each row indicates a transcript that overlaps the indicated chromatin state.

