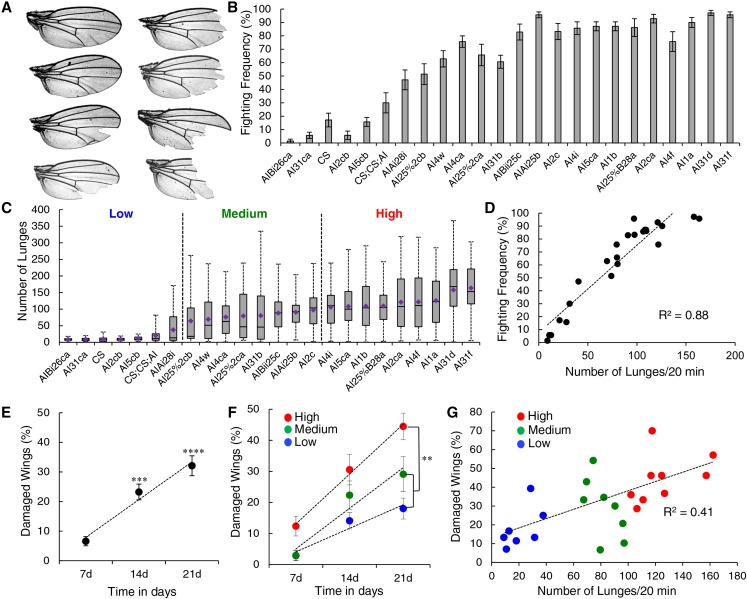
Figure 1.
Wing damage correlates with aggression. (A) Example wings from group-housed aggressive males. Damage ranges from small nicks to missing the entire distal portion. (B) Fighting frequencies of 24 genetically related strains, ranging from low to high aggression, n = 70 pairs per genotype. (C) Lunge counts from CADABRA video analysis for the same strains as in (B) ranked in order of increasing mean lunge number. Strains were categorized into low- (< 40 lunges), medium- (40–100 lunges), and high- (> 100 lunges) aggression groups. n = minimum of 40 pairs per genotype. (D) Correlation between the two measurements of aggression: fighting frequency and mean number of lunges (R2 = 0.88, P < 0.0001). (E) The percentage of wings with damage increased over time across all strains. Both 14- and 21-day group-housed males had a significant increase compared to 7-day group-housed males (ANOVA, 21 day vs. 7 day: P = 0.0001; 14 day vs. 7 day: P = 0.0017; and 21 day vs. 14 day: P = 0.07). (F) The highly aggressive group of flies (red) had increased wing damage at all time points compared to the medium- or low-aggressive groups. At 21 days, the highly aggressive group had statistically significantly more wing damage than the medium- (green) and low-aggressive groups (blue) (two-way ANOVA, P < 0.01). (G) Wing damage and average number of lunges are positively correlated at 21 days (R2 = 0.41, P < 0.001). See also Figure S1 in File S1, and File S2.

