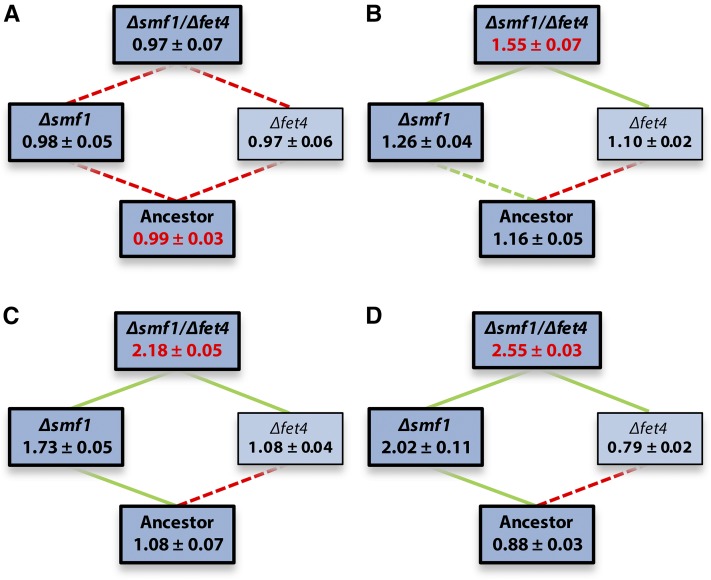
Figure 1.
Predicted fitness ± SEM of reconstruction mutants in the presence of 0 (A), 1 (B), 2 (C), or 3 (D) µM CdCl2. Edge color reflects how the addition of each mutation (i.e., from bottom to top) affects fitness (green, increase; red, decrease; significance was assessed using a linear model fitted to all Cd data). Solid lines represent significant changes, dotted lines nonsignificant ones. After sequential Bonferroni correction, all comparisons remain significant. Bold, darker boxes correspond with (combinations of) mutations found in clones isolated from the evolution experiment. Red fitness values represent global optima.

