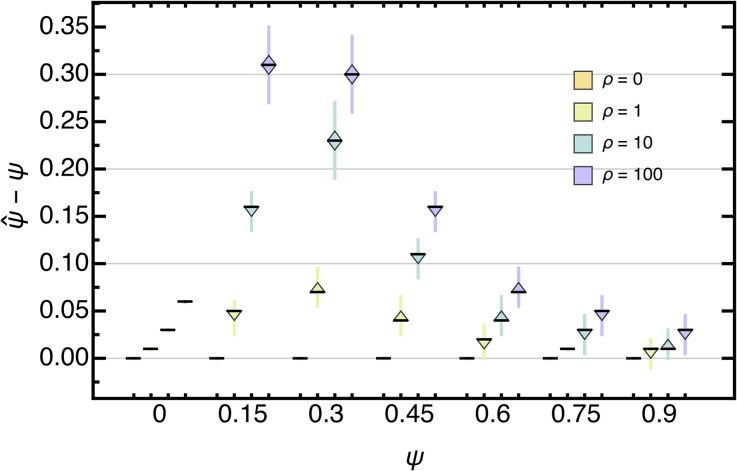
Figure 8.
Boxplot of the deviation of the maximum likelihood estimate from the true ψ for data sets, assuming independent sites with and θ (Equation 45) with when not accounting for population growth. Boxes represent the interquartile range (i.e., the 50% C.I.), and whiskers extend to the highest/lowest data point within the box times the interquartile range.

