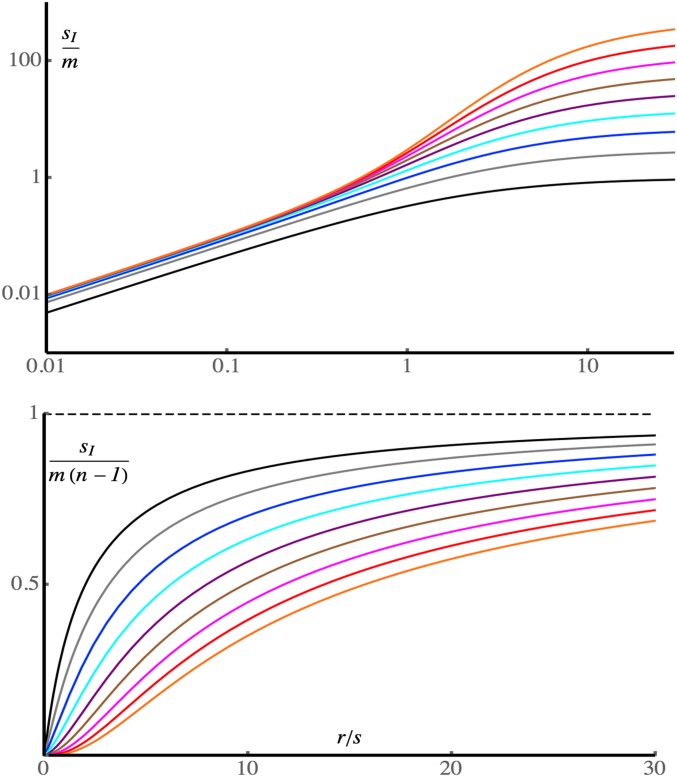
Figure 1.
The selective advantage of an inversion, sI, in the limit of low migration, for n = 2, 4, 8, …, 256, 512 loci, plotted against r/s. The upper plot shows sI/m on a log-log scale, with the number of loci increasing from bottom to top. The lower plot shows sI /m(n−1), with the number of loci increasing from top to bottom; the dashed line indicates the selective advantage in the limit of loose linkage, m(n−1). The curves were calculated using the recursion in Equation 3 of Barton (1983).

