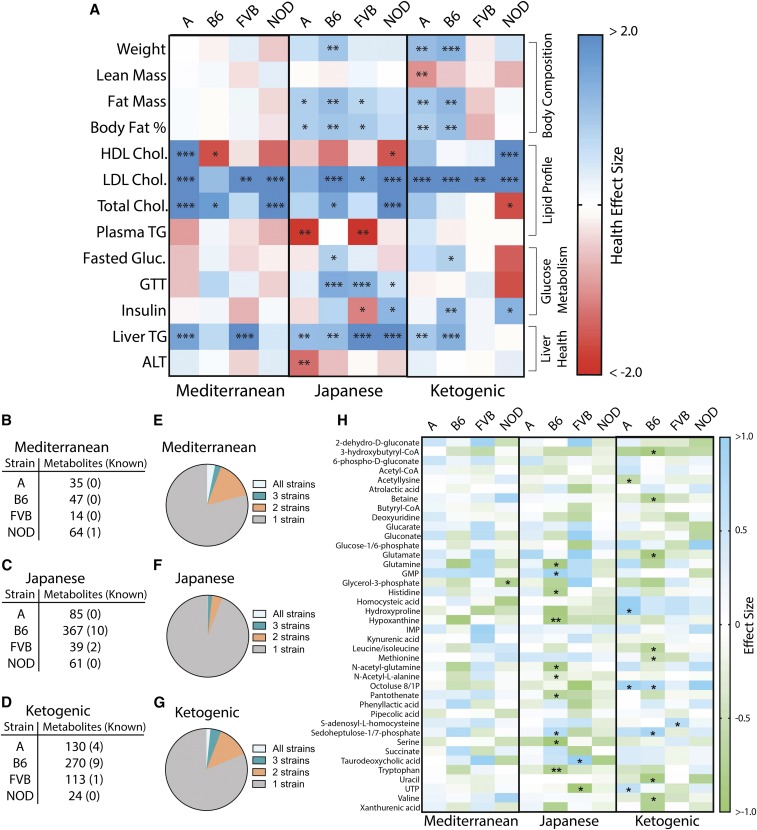
Figure 5.
Comparison of metabolic phenotypes and liver metabolites in mice fed Mediterranean, Japanese, or ketogenic diets relative to the American diet. (a) Heatmap of health effect size (Cohen’s d, with higher value indicating improved health and lower value indicating diminished health) for metabolic phenotypes across strains. * P < 0.05, ** P < 0.01, and *** P < 0.001 by ANOVA between means, with Dunnett’s correction to the American diet within each strain. Number of known and unknown liver metabolites significantly altered compared to the American diet for (b) Mediterranean diet, (c) Japanese diet, and (d) ketogenic diet. Proportion of metabolites significantly changed in all four strains, three strains, two strains, or unique to one strain for (e) Mediterranean, (f) Japanese, and (g) ketogenic diets. (h) Heatmap of effect sizes (Cohen’s d) of known metabolites significantly altered relative to the American diet across strains, including metabolites that differed between American and control mouse diets (Figure 3g). * P < 0.05, ** P < 0.01, and *** P < 0.001 by ANOVA between means with Benjamin–Hochberg correction factor. A, A/J strain mice; ALT, alanine aminotransferase; B6, C57BL/6J strain mice; FVB, FVB/NJ strain mice; GTT, glucose tolerance test; HDL high-density lipoprotein; LDL, low-density lipoprotein; NOD, NOD/ShiLtJ strain mice; TG, triglyceride.

