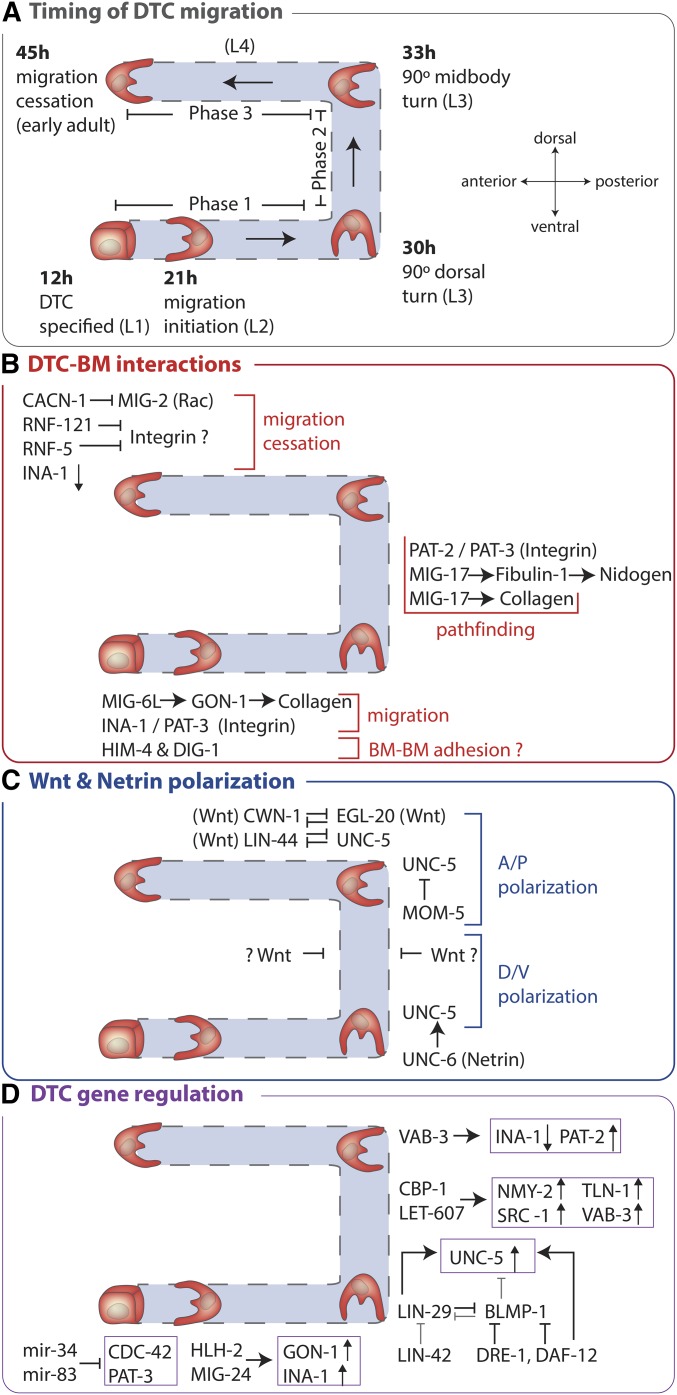
Figure 5.
DTC migration timing, BM interactions, polarization, and gene regulation. Only the posterior gonad arm is shown. (A) The timing of DTC migration shown is at 20°. (B–D) Details of proteins and interactions that regulate DTC migration are described in the text and outlined here for a global view. Note, the “Wnt ⊣” shown in (C) represents a hypothetical possible function for Wnt in inhibiting polarization along the anterior-posterior axis during phase 2 of DTC migration.

