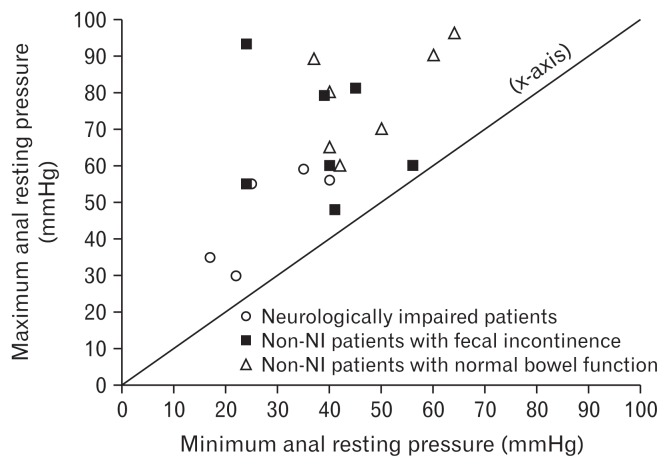
Figure 1.
Measurements of anal resting pressure (n = 19). Vertical axis represents maximum anal resting pressure; horizontal axis represents minimum anal resting pressure. Note the anal resting pressure lower than 60 mmHg in all 5 neurologically impaired (NI) patients (circle dots) and the tendency to be closer to the bisector (labelled as the x-axis). The closer the dot to the bisector, the smaller the difference between the maximum and the minimum anal resting pressure of the case.

