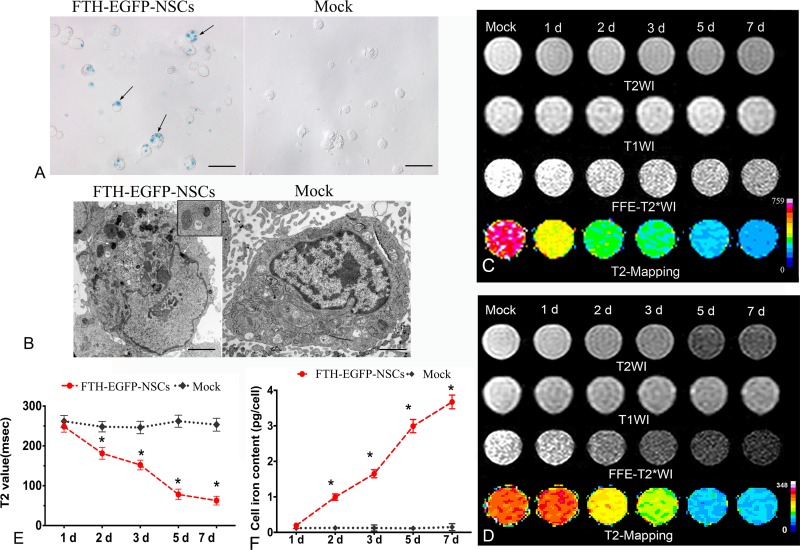
Fig. 2.
Cellular transduction effect and stability. (A) Prussian blue staining micrograph shows numerous blue-stained particles inside the cytosol of NSCs transduced with LV-FTH-EGFP (FTH-EGFP-NSCs), while no such particles were in mock-transduced NSCs (Mock). Scale bar = 10 μm. (B) Transmission electron microscopy micrographs demonstrate many iron particles in the cytosol of LV-FTH-EGFP-transduced NSCs (FTH-EGFP-NSCs, white arrows) but not in mock-transduced NSCs (Mock). The inserted magnified view shows a single iron-positive organelle. Scale bar = 2 μm. (C) In vitro MRI at 1.5 T and (D) 3.0 T both show a gradually decreased hypointense signal in cells transduced with LV-FTH-EGFP on T2- and T2*-weighted imaging over time. (E) T2 value decreased and (F) cellular iron content increased in a time-dependent manner in cells transduced with LV-FTH-EGFP but not in mock-transduced cells. LV-FTH-EGFP, lentiviral vector encoding ferritin heavy chain and enhanced green fluorescent protein; MRI, magnetic resonance imaging; NSCs, neural stem cells. *P < 0.05 compared with mock-transduced cells.

