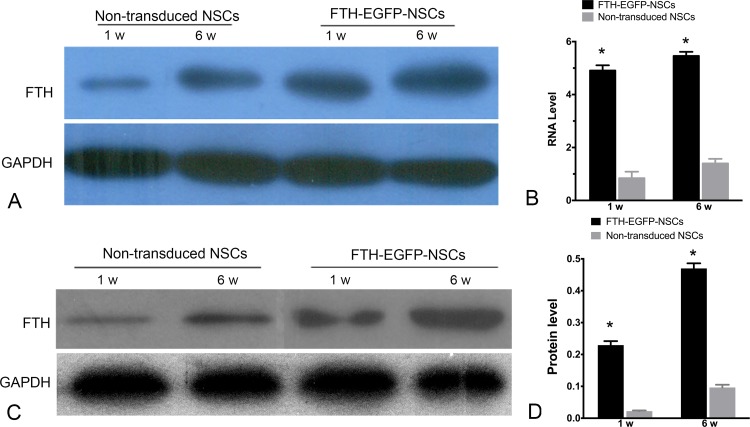
Fig. 8.
In vivo FTH expression of grafted cells. (A) RT-PCR and (B) Western blot analysis show high FTH expression in animals grafted with LV-FTH-EGFP-transduced NSCs (FTH-EGFP-NSCs) compared with animals grafted with nontransduced NSCs at 1 and 6 wk after transplantation. Graphs show the densitometric analysis of FTH RNA levels (B) and protein levels (D) in animals grafted with LV-FTH-EGFP-transduced NSCs (FTH-EGFP-NSCs) and with nontransduced cells. FTH, ferritin heavy chain; LV-FTH-EGFP, lentiviral vector encoding ferritin heavy chain and enhanced green fluorescent protein; RT-PCR, real-time PCR; NSCs, neural stem cells. *P < 0.05 compared with nontransduced cells.

