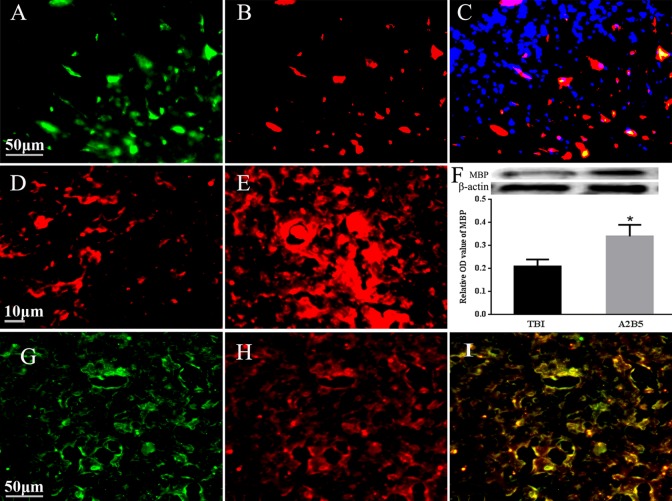
Fig. 2.
Detection of differentiation on engrafted A2B5+ cells in the brain. (A) Engrafted A2B5+ cells; (B) Olig2+ cells; (C) merged picture from A2B5+ cells and Olig2+ cells plus DAPI stain; (D) MBP staining in TBI brain; (E) MBP staining in A2B5+ grafts after TBI; (F) the comparison of MBP expression indicated by WB. *Compared with TBI group, P < 0.05. G, H, and I are to show the myelinogenisis from transplanted A2B5+ cells. (G) GFP recognition from myelin sheath, (H) MBP staining, (I) merged piture to show myelin sheath are resulted from grafted A2B5+ cells. Scale bar = 50 μm, shown in A, G, and 10 μm in D. Olig2, oligodendrocytes 2; MBP, myelin basic protein; TBI, traumatic brain injury.

