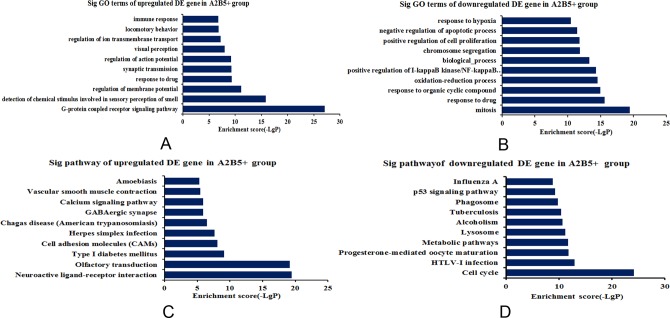
Fig. 6.
GO enrichment and KEGG pathway analysis of differentially expressed mRNAs in the A2B5+ iPSC group. (A) Top 10 GO terms enriched among upregulated mRNAs according to biological processes. (B) Top 10 GO terms enriched among downregulated mRNAs according to biological processes. (C) The top 10 pathways enriched among the upregulated mRNAs. (D) The top 10 pathways enriched among the downregulated mRNAs. The bar plot depicts the enrichment scores. The P value indicates the significance of the correlation between the pathway and the transplantation of A2B5+ iPSCs in TBI. mRNA, messenger RNAs; TBI, traumatic brain injury; iPSC, induced pluripotent stem cell.

