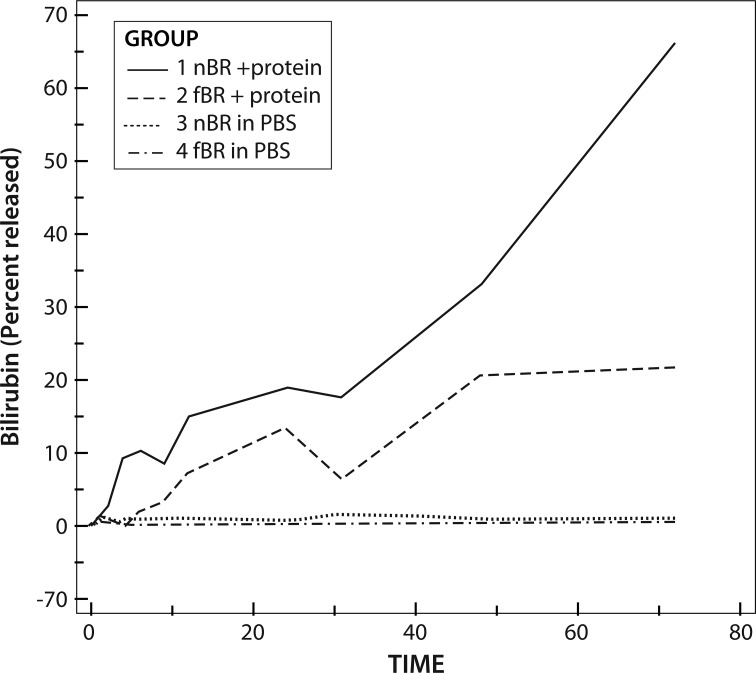
Fig. 4.
Release of bilirubin, expressed as percentage of original bilirubin concentration, through a 20 kDa dialysis membrane, suspended in dialysate with or without protein. Group 1: nanoparticle bilirubin (nBR) in phosphate-bufferd solution (PBS) + 10% albumin; Group 2: free bilirubin (fBR) in PBS + 10% albumin; Group 3: nBR in PBS; Group 4: fBR in PBS. Area under the curve for bilirubin release in each of the 4 groups was significantly different (P = 0.0156). Release was significantly greater for nBR than for fBR and in solutions containing protein compared to PBS alone (P < 0.001). For nBR in PBS +10% FBS, there was an initial burst of release over approximately 8 h, followed by a more steady release up to 48 h.

