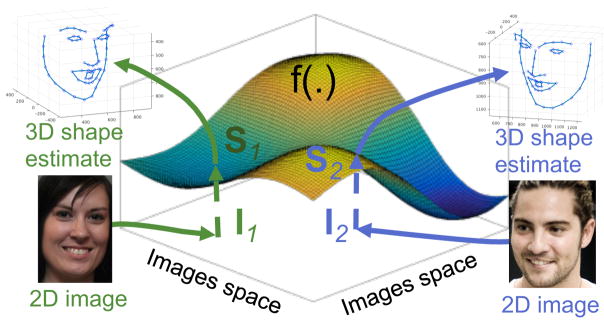
Figure 3.
This plot illustrates the idea of a regressor. Here, two of the axes define the image space. The third (vertical) axis defines the 3D-shape. Of course, in reality the image space and the 3D-shape space are defined by more dimensions. The function f(.) is the regressor. It defines a non-linear manifold. This manifold specifies the mapping between an image Ii and its 3D-shape Si, i.e., Si = f(Ii).

