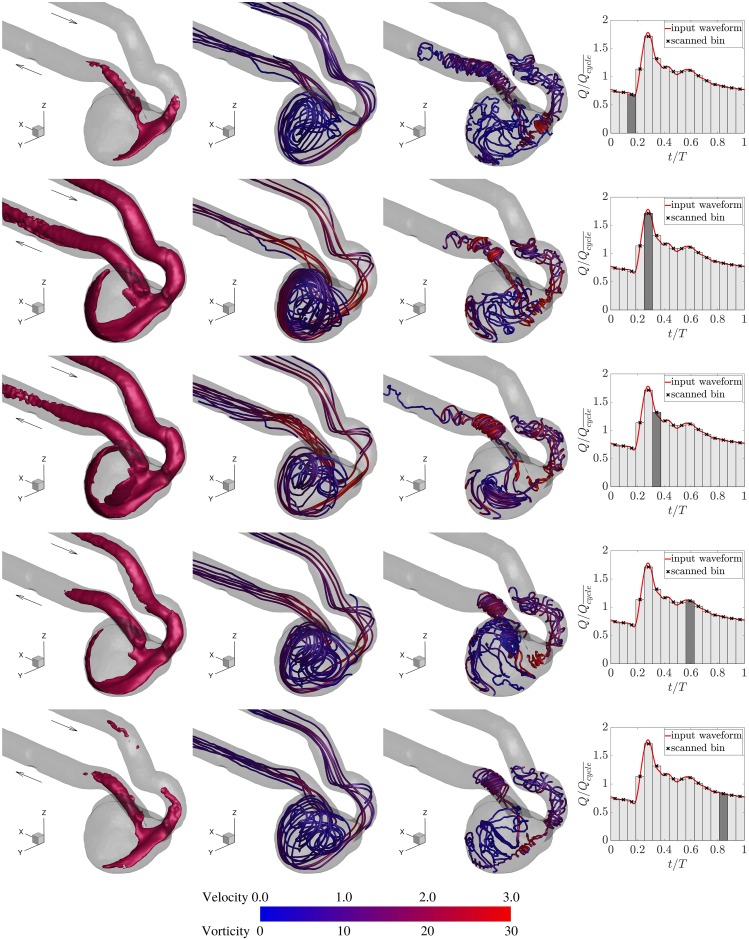
Fig 5. Columns from left to right: Iso-surface of the velocity magnitude at , streamlines, vortex lines, and the measurement phase.
Five measurement phases from top to bottom rows are early systole, systolic peak, late systole, dicrotic notch, and late diastole, respectively. Streamlines are colored by the normalized velocity magnitude (), and vortex lines are colored by the normalized vorticity magnitude ().

