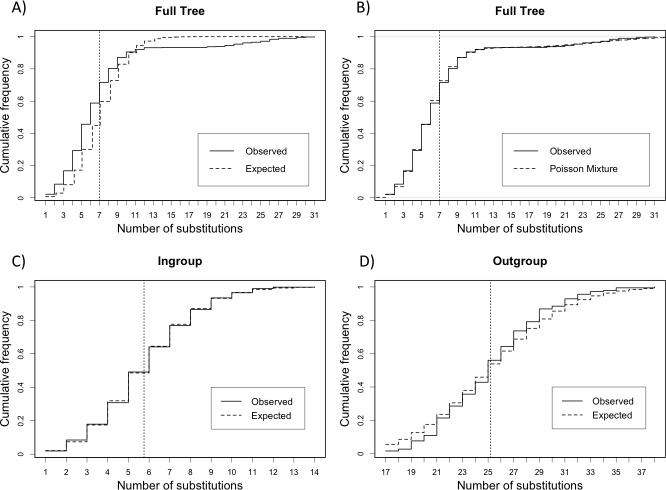
Fig 2. Empirical cumulative distributions and expected cumulative distributions of the simulated sequences ensemble.
Vertical dotted line indicates the mean value. Panels (a) and (b) display the ECD of the full tree against the expected cumulative Poisson distribution with mean branch length λ = 7.01 and the expected cumulative Poisson mixture, respectively. Panel (c) displays the ECD of the ingroup against the expected cumulative Poisson distribution with mean branch length λ = 5.75. Panel (d) displays the ECD of the outgroup against the expected cumulative Poisson distribution with mean branch length λ = 25.18.

