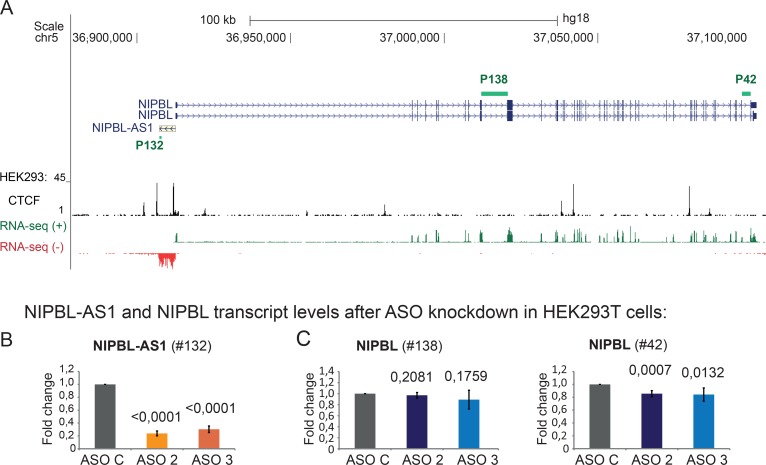
Fig 1. NIPBL-AS1 does not influence NIPBL transcription.
A) Overview of the genomic position of NIPBL and NIPBL-AS1 genes. Strand-specific read coverage of RNA-sequencing data (positive in green; negative in red) from HEK293T cells shows the transcription of NIPBL-AS1 antisense to NIPBL [1]. CTCF binding sites in HEK293 cells (ENCODE hg18) are shown. Primers used in the transcript analysis are indicated as green bars. (B-C) Transcript levels of (B) NIPBL-AS1 and (C) NIPBL after antisense oligonucleotide knockdown (ASO2, ASO3) of NIPBL-AS1 in HEK293T cells. ASO C was used as control. Transcript levels were normalized against the control sample (ASO C) and the housekeeping SNAPIN using the ΔΔCt method (mean n = 3, error bars +/- s.d., p-values determined with t-Test).

