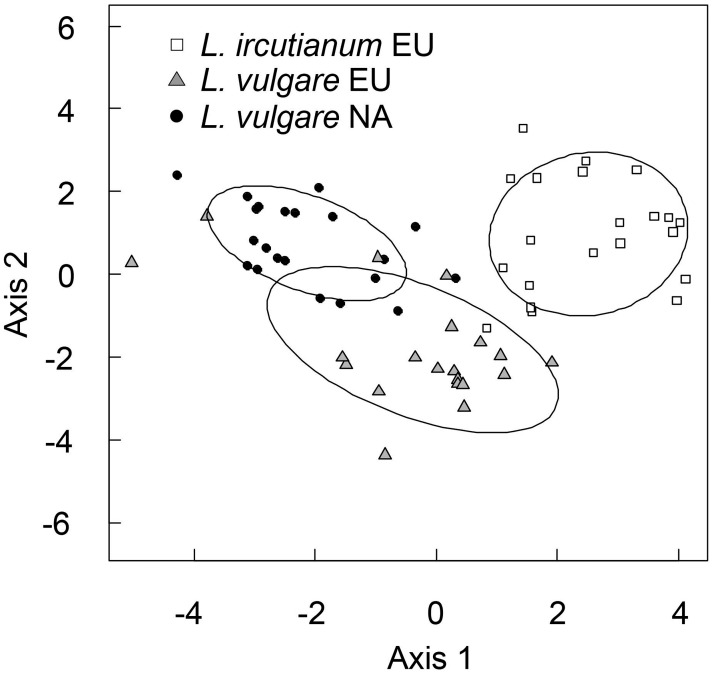
Fig 2. Principal Component Analysis (PCA) plot based on population mean values of 17 traits measured from ten plants from 62 populations of Leucanthemum vulgare and L. ircutianum from the native (Eurasia, EU) and introduced (North America, NA) range grown under standardized conditions.
To show the phenotypic space occupied by each species from the native and introduced range confidence ellipses defined by the gravity center (centroid) of the cloud and 1.5 times the standard deviation were constructed. The first axis explains 31.7% of the total variation in the dataset; the second axis explains 17.9%.

