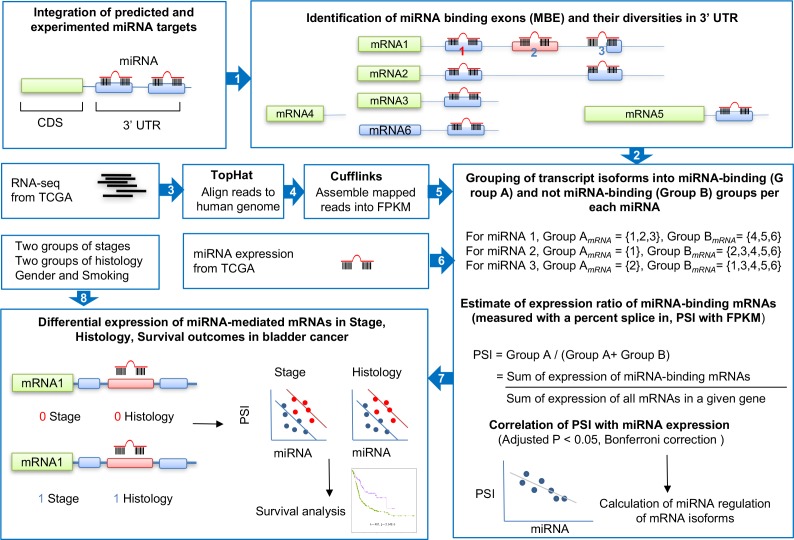
Fig 1. Study design overview.
Step 1 involved constructing a comprehensive set of relationships between mRNA and miRNA by compiling three existing miRNA target databases: miTarBase, TargetScan, and miRanda. Step 2 involved searching for the miRNA-binding exons (MBEs) and identifying which transcript isoforms retain or do not retain MBEs. When a transcript isoform loses miRNA binding sites in the 3′ UTR due to one of these events—i.e., 1) exon skipping (miRNA 2 in mRNA2), 2) alternative splice 3′ or 5′ splice sites (miRNA 3 in mRNA1), 3) mutually exclusive 3′ UTR regions (i.e. mRNA3 vs. mRNA5 and mRNA5 vs. mRNA6), defining the case that miRNA binding sites in the genomic regions translated into the two mRNAs do not overlap each other at all, and 4) others in these three cases (i.e., retained introns, non-coding RNA, and alternative polyadenylation)—it was assigned to miRNA-binding Group A; otherwise, it was assigned to Group B. Steps 3, 4, and 5 were to not only identify alternative splicing isoforms and splicing events, but also calculate FPKM as a quantitative expression level using TopHat and Cufflinks. We used level 3 data for miRNA expression in the TCGA. Step 6 integrated comprehensive sets of MBEs status in 3′ UTRs with the expression of miRNA and mRNA and, therefore, estimated the relative expression ratio between Group A (i.e., transcript isoforms repressed by miRNA, defined by MBE-retaining mRNA) and all mRNA expression. This is a normalized measurement of the miRNA-mediated repression ratio to the overall transcript expressions per single gene. The multiplicity was corrected by the Bonferroni method. Step 7 first tested an association of differential expression of miRNA-mediated transcript isoforms in the two-stage and histology groups and then predicted overall survival time in the bladder cancer cases.

