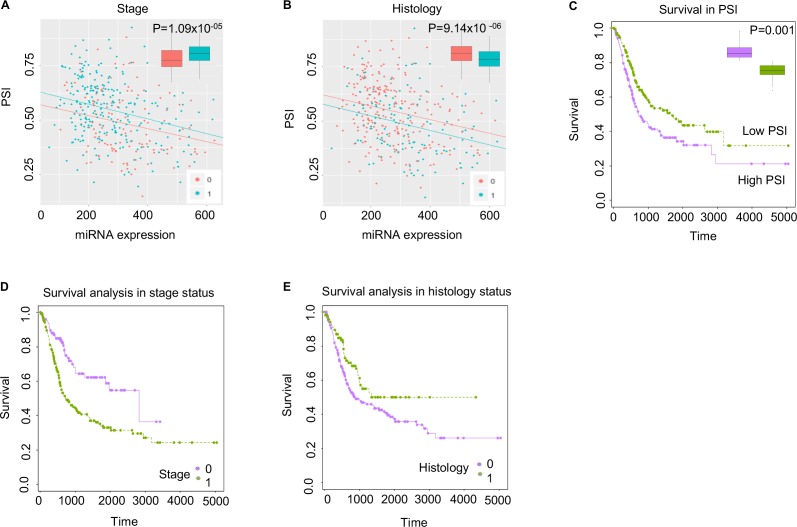
Fig 3. Case study of the VEGFA gene, which shows statistically significant differential expression of miRNA-mediated transcript isoforms between stage status, histology status, and survival outcomes.
For plots A and B, the x-axes represent miRNA expression, and the y-axes represent the relative ratio of miRNA-mediated transcript isoforms expression to overall transcript isoforms expression per a single miRNA (i.e., hsa-miR-361-5p). The p-value was corrected with the Bonferroni method (A) Red dots and blue dots represent stage 0 and stage 1 of bladder cancer, respectively. (B) Red dots and blue dots represent histology 0 and histology 1 of bladder cancer, respectively. (C) In the two groups of bladder cancer cases that expressed high PSI and low PSI, the later showed better survival outcomes, compared to the latter. As expected, more severe stage group 0 (i.e., purple plot in (D) and histology group 1 (i.e., green plot in E) exhibited a shorter expected survival time.

