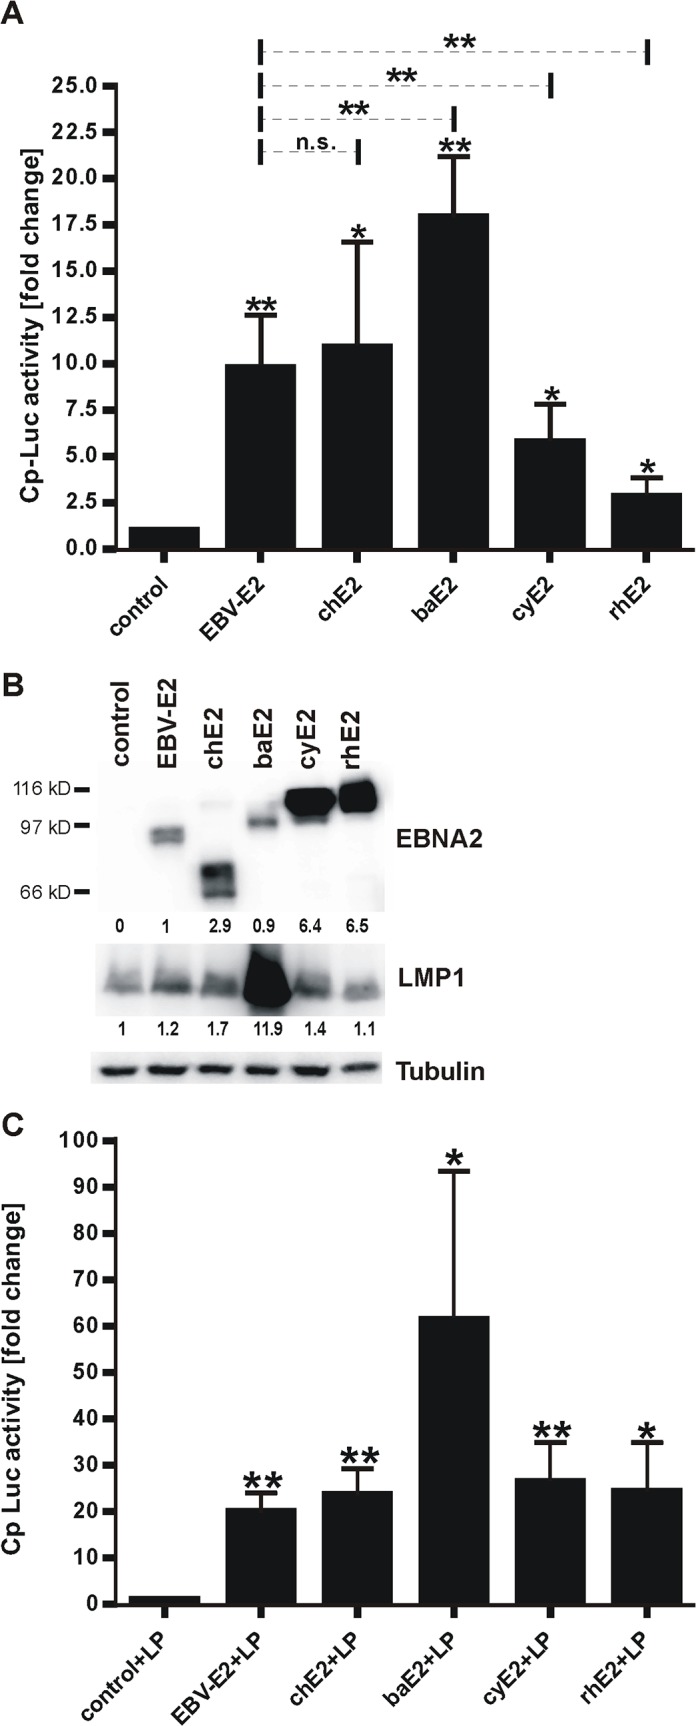
Fig 4. Transactivation activity of NHP EBNA2s in human B cells.

P3HR-1 cells were transfected with a Cp-Luciferase reporter, a Renilla control, and EBNA2 expression plasmids or empty control. A) 48h after transfection Luciferase and Renilla levels were measured and normalized to Renilla. Cp transactivation levels shown represent fold change over control transfection. Asterisks above standard deviation bars indicate significance relative to control, and asterisks above the dotted lines indicate significance relative to EBV E2. * p<0.05, ** p<0.01, n.s. not significant, n = 4. B) EBNA2 and LMP1 were quantified from a representative reporter assay by immunoblot, and tubulin was used as loading control. Relative expression levels of EBNA2 normalized to EBV E2 sample and LMP1 normalized to levels of control transfection are quantified under each blot. C) Cp activity in response to EBNA2 and EBNA-LP co-expression was analyzed as described for panel A) with co-transfection of an EBNA-LP expression plasmid. Luciferase levels represent fold change over LP alone (control+LP).
