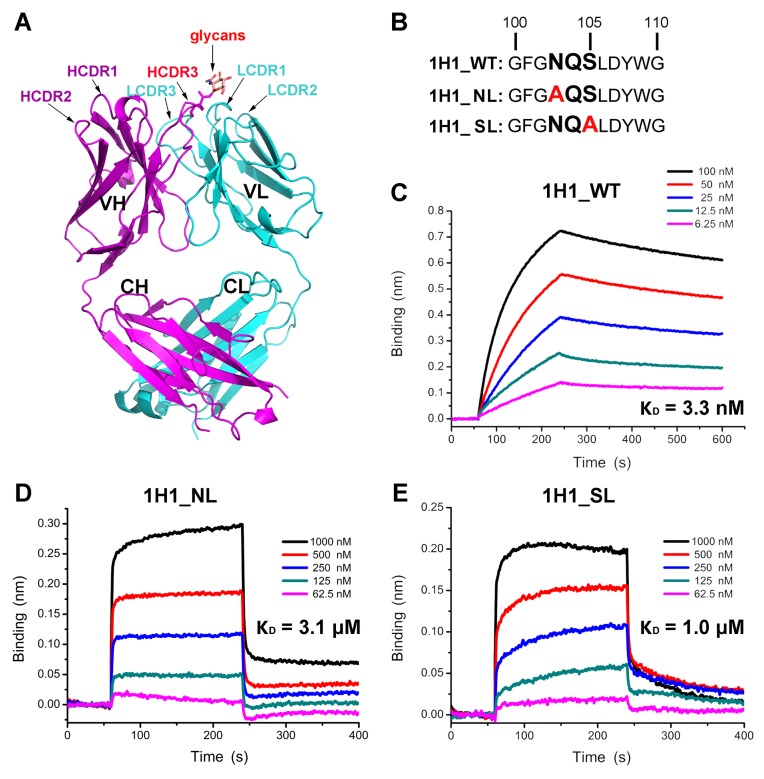
Fig 3. The effect of glycans on antigen recognition of 1H1 Fab.
(A) Crystal structure of 1H1 Fab. The heavy chain and light chain are colored in magenta and cyan respectively. The CDR loops are labeled. The HCDR3 and attached glycans are highlighted by red labels. (B) The “NXS” sequence motif, potential N-linked glycosylation sites, in the HCDR3 of 1H1 mAb. The two site mutations to eliminate glycans are highlighted by red. (C-E) The kinetics of wild type and mutant 1H1 Fab binding to PRV gB determined by Octet. The binding curve of each concentration is represented by different colored as the legend. The calculated dissociation constants (KD) are shown beside each figure correspondingly.

