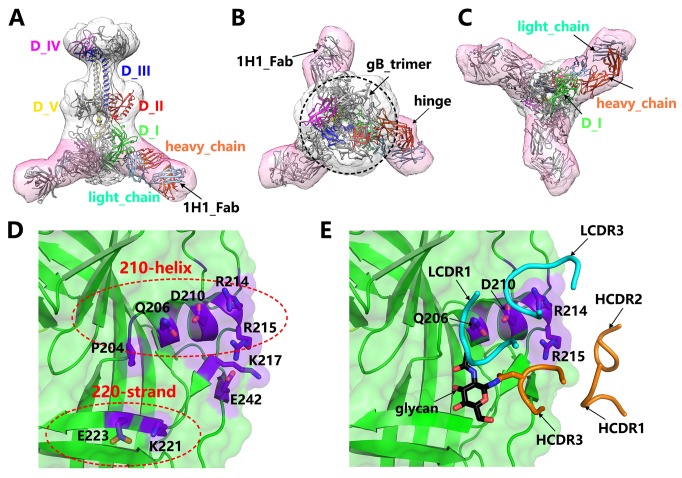
Fig 4. Epitope of 1H1 mAb.
(A-C) The EM structure of PRV gB in complex with 1H1 Fab determined by negative stain EM 3D reconstruction. The density map is shown as transparent surfaces and the fitted atomic models are represented by ribbons. The densities corresponding to gB trimer and 1H1 Fab are colored in grey and pink, respectively. The atomic model of one protomer in the PRV gB trimer is colored by domains and labeled accordingly. The heavy chain and light chain of 1H1 Fab are colored in orange and cyan, respectively. This structure clearly shows the binding site of 1H1 Fab in domain I of PRV gB. (D) Potential key residues in the 1H1 epitope on the surface of PRV gB. These residues mainly cluster into two regions, the 210-helix and 220-strand portions. (E) The potential interaction interface between PRV gB and 1H1 Fab. The CDR loops involved in the binding are shown as smooth ribbons and colored by chains as in (A-C). The glycan residue in the HCDR3 is highlighted by a black arrow. The four key residues in the 210-helix region, the main binding footprint, are labeled accordingly.

