
Figure 2. Microglia in distinct BG nuclei exhibit unique branching structure.
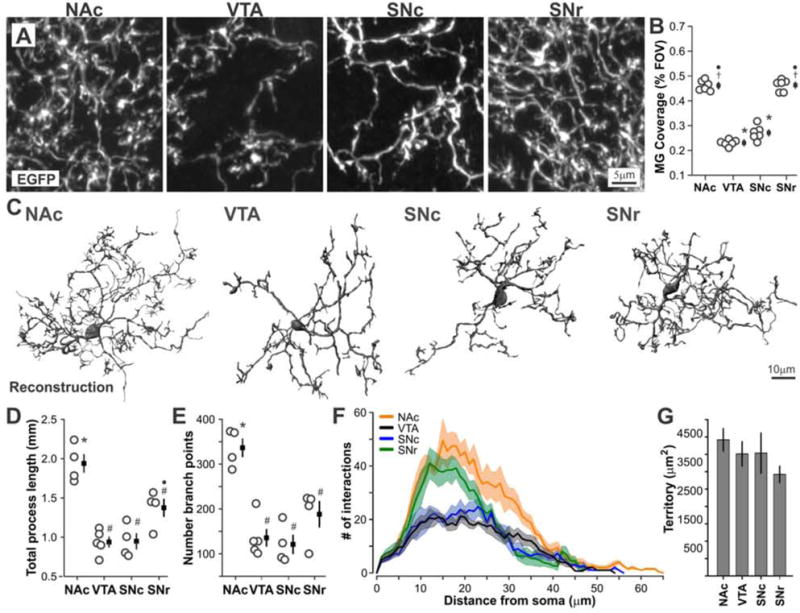
A – Confocal images of BG microglial branching structure. B – Microglial tissue coverage (% field of view occupied by microglial processes and somas). ANOVA F(3,20) = 184.6, P < 0.00001. N = 6 mice per region. See also Fig. S1A. C – 3D reconstruction of individual microglia (raw images in Fig. S1B). D – Total process length of reconstructed cells. ANOVA F(3,13) = 21.7, P = 0.00003. N = 4–5 cells per region, each cell from different mouse. E – Number of branch points. ANOVA F(3,13) = 17.7, P < 0.00008. F – 3D Scholl analysis showing mean ± standard error (shaded) for all reconstructed cells. G – Approximate territory of reconstructed cells. ANOVA F(3,13) = 1.05, P = 0.40 (n.s.). All mice were age P58–60. # P < 0.05 vs. NAc, ● P < 0.05 vs. VTA, † P < 0.05 vs. SNc, ¥ P < 0.05 vs. SNr. * P < 0.05 all individual comparisons.