
Figure 5. Generation of whole transcriptome RNAseq data from microglia of distinct BG nuclei.
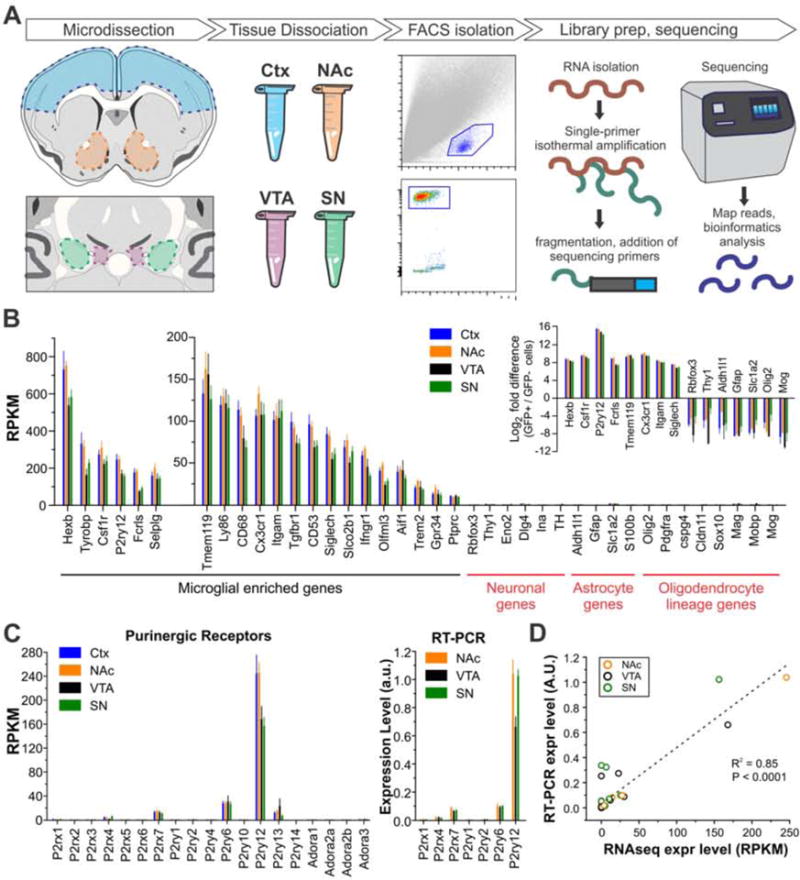
A – Diagram illustrating RNAseq workflow. B – Expression levels for microglial-, neuron-, astrocyte-, and oligodendrocyte lineage-enriched genes. Inset shows fold change of cell-specific genes in EGFP+ compared to EGFP− cells. N = 6 – 8 samples per group; each sample represents data of microglia isolated from the BG nucleus of an individual mouse. C – Left, expression of ionotropic and metabotropic purinergic receptors as assessed by RNAseq; Right, expression of purinergic receptor subset as assessed by RT-PCR. D – Comparison of gene expression levels measured by RNAseq (mean RPKM, N = 6–8 samples per region) with levels measured by RT-PCR in samples prepared from an independent cohort of mice (average expression value, N = 5 samples per region; each sample represents data from microglia isolated from the BG nucleus of an individual mouse). Linear regression R2 = 0.85, P < 0.0001. Data from individual target genes shown in Fig. 5C and Fig. S4 A,B. N = 17 target genes. See also Figs. S3–4.